Graphs

|
In this graph we see that 30% of pollutants entering the ocean are caused by sewage.
|
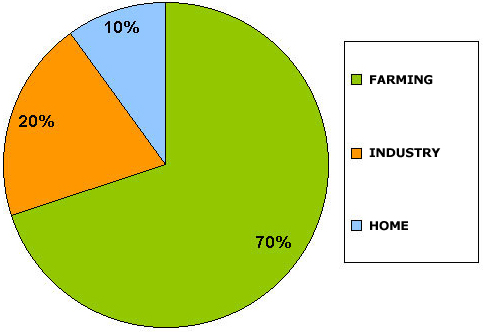
Of that 30% of sewage entering the ocean that we saw on the first graph, 70% is caused by farming and agricultural waste, 20% is caused by industrial waste and 10% is caused by common everyday household waste.
|
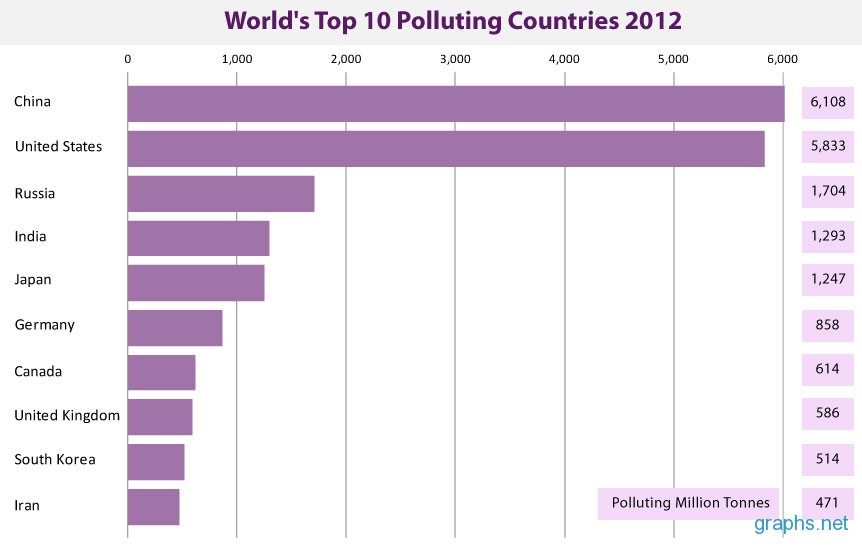
In this graph above we see overall pollution by country and the U.S is second place with a grand total of around 5,833 million tons per year.
